People in some parts of our country often have to base decisions on the weather. Snowstorm, hurricane, torrential rainstorms can impact actives and schedules. We in the San Joaquin Valley don’t really have those types of concerns, unlike them, we have to be concerned with quality of our air.
The American Lung Association’s “State of the Air” report lists the most polluted cities in the US. Of the top 13 cities on the list, our cities, Fresno, Madera, Merced, Hanford, etc… hold seven spots.
The San Joaquin Valley has the most polluted air in the country
Whether on the news or on the front page of the Baz Allergy Asthma & Sinus Center website, we often see air quality forecasts and meters displaying information on the quality of our air, usually in colors – green, yellow, orange, etc… What does “yellow” really mean? Yellow means “moderate”. What does “Moderate” mean and what factors contribute to to a forecast of Yellow/Moderate?
Polluted Air
In the San Joaquin Valley, air pollution is typically caused by two sources: Ozone & Particulate Matter. The EPA tracks five types of air pollution for the air quality index (more on that below) but these two are the main sources in the Valley.
Ozone: You’ve heard of “the ozone layer”, it’s up in the stratosphere and it protects earth from the sun’s ultraviolet rays. Ozone pollution, commonly known as smog, is developed in the atmosphere from gasses that come from tailpipes, smokestacks, etc.. It’s produced from a reaction caused when these gasses, in the right combination, come into contact with sunlight.
A detailed description of ozone pollution can be found on the AirNow site.
Ozone pollution is nasty stuff, it can cause breathing problems, cardiovascular effects, harm to the central nervous system as well as potential reproductive and developmental harm. More information on Ozone’s health threat can be found in the US EPAs study on ozone pollution and health threats report.
The 2 major types of air pollution in the San Joaquin Valley are Ozone Pollution and Particulate Matter
The second source of air pollution in the San Joaquin Valley is from Particulate Matter. Particulate pollution is a mixture of tiny particles and liquid droplets found in the air. Some particles are so tiny they require a sophisticated microscope to see, others can be seen on what we’d call a hazy day. The smaller the particle, the more troublesome. Here’s an example of how small they are; the average human hair is 70 micrometers in diameter. The size of the particles polluting our air are 10 micrometers and smaller. If one of your hairs was as thick as a football field, the particles polluting our air are typically from the 10 yard line down to the 2 yard line in size. Very tiny yet very bad for your lungs.
Particles can come from construction sites, dust from an unpaved road, industrial plants, automobile exhaust and wildfire smoke, which we wrote about in a previous blog post Wildfire Smoke has a Deadly Effect on Health
Smoke particles are a main reason why the San Joaquin Valley Air Pollution Control district has issued new rules on wood burning this year article here
Here’s a link to the EPA’s definition of Particulate Matter http://www3.epa.gov/pm/basic.html
Geography
Incidentally, and not part of the Air Quality Index, one of the major factors causing such low levels of air quality is our geography. The Valley floor is surrounded by mountains and this geological configuration basically traps the polluted air (ozone & particulate matter) near the Valley floor where we all live. Unlike other areas where a mighty wind can blow the polluted air away, the mountain ranges don’t promote such a cleansing wind.
Mountains surrounding the Valley trap polluted air and prevent wind from blowing it away
With this basic understanding of the makeup of the Valley’s air pollution, we can better understand the numbers and colors displayed on the EPA’s Air Quality Index.
EPA Air Quality Index
The US Environmental Protection Agency (EPA) developed an Air Quality Index designed to display the air quality level that is mapped to the concern for human health. The worse the air quality is on a given day, the stronger the warning displayed on the Air Quality Index.
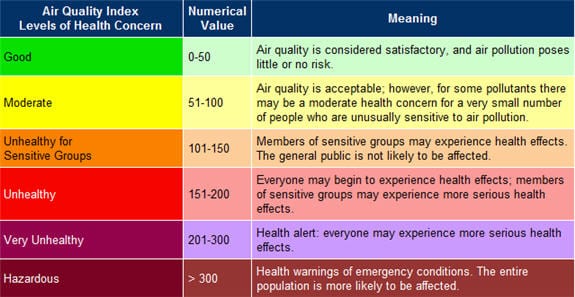
The first item to understand about the AQI is the Air Quality Index Value (Numerical Value on the image above).
The AQI measures five different types of air pollutants; Ozone & Particulant Matter described earlier, also carbon monoxide, sulfur dioxide and nitrogen dioxide. All five pollutants are measured, typically every 8 hours but on severe days measurement can be hourly. The EPA has defined a set of standards for air pollution, tests are performed to analyze air quality and the results are assigned a number. This number is based on a score of 100 with 100 being the cut off before air quality is considered unhealthy.
Less than 100 means better air quality than a measurement over 100, a measurement below 50 is considered GOOD. A measurement over 300 is HAZARDOUS – very bad
The math used to determine the AQI levels can be found here.
Air Quality Index numbers less than 100 means better air quality than a numbers over 100
Whichever pollutant of the five has the highest number, that is the pollutant and number used to determine that day’s Air Quality Index. The Air Quality Index breaks down the numbers like this:
1-50 is Good: Air quality is satisfactory and air pollution poses little or no risk
51-100 is Moderate: Air quality is acceptable; however, for some pollutants there may be a moderate health concern for a very small number of people. For example, people who are unusually sensitive to ozone may experience respiratory symptoms.
101-150 is Unhealthy for Sensitive Groups: Although general public is not likely to be affected at this AQI range, people with lung disease, older adults and children are at a greater risk from exposure to ozone, whereas persons with heart and lung disease, older adults and children are at greater risk from the presence of particles in the air.
151-200 is Unhealthy: Everyone may begin to experience some adverse health effects, and members of the sensitive groups may experience more serious effects.
201-300 is Very Unhealthy: This would trigger a health alert signifying that everyone may experience more serious health effects.
More than 300: Hazardous: AQI greater than 300. This would trigger a health warnings of emergency conditions. The entire population is more likely to be affected.
The levels of “Health Concern” on the Air Quality Index are also presented by color for faster recognition; Green, Yellow, Orange, Red, Purple and Maroon. The colors are mapped to the recommended level of concern one should consider when making plans for being outdoors on that particular day.
Green = Good
Yellow = Moderate
Orange = Unhealthy for Sensitive Groups
Red = Unhealthy Purple = Very Unhealthy
Maroon = Hazardous
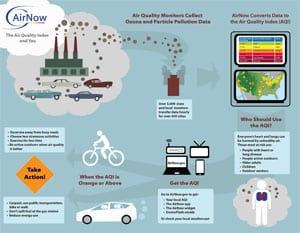
A test performed today may show that Particle Matter has a score of 37 and Ozone pollution has a score of 164. Ozone, being the higher number, would be considered the main factor in determining today’s Air Quality Index number. A score of 164 means that the Air Quality is UNHEALTHY and the associated index color would be red. Here’s a nice graphic on how air quality monitors collect ozone and particulate matter data from AirNow (click image for full size poster)
The Lung Association has an online tool that allows you to enter your zip code to see the report card for the air in your neighborhood. Find it on the State of the Air site here.